Measurement of the temperature coefficient
Ozcan Bazkir, Scientific and Technological Research Council of Turkey (Türkiye Bilimsel ve Teknolojik Araştırma Kurumu, TÜBİTAK), Tunus Caddesi No:80, 06100, Kavaklıdere, Ankara
Measurement of temperature coefficients
The temperature coefficients of a photovoltaic (PV) device are generally perceived as its percentage change of the electrical parameters (e.g. short circuit current ISC, open circuit voltage VOC, maximum power PMax, spectral responsivity s(λ)) with change of temperature. The calibration values and hence datasheet values of PV devices always refer to standard test conditions, i.e. irradiance of 1000 W/m², AM1.5g spectral irradiance distribution and device temperature of 25°C. Hence the temperature coefficients are needed to calculate the performance of the PV device for real operating conditions dependent on ambient temperature and the heat load from the solar irradiance. Therefore, the knowledge about the temperature coefficients for specific PV-modules can be of major interest for PV project planners and PV yield modeling. The IEC standard 61853-1 and 60904-10 describe the procedures for such linearity measurements.
This article gives an overview of the measurement procedures and setups currently available or under deployment for temperature coefficient measurements.
Temperature coefficients of short-circuit current α(%/K), open-circuit voltage β(%/K) and maximum power κ(%/K) can be determined using solar simulators or natural sunlight by measuring these parameters of a PV module under the constant irradiance level and a range of temperature. The irradiance is provided by the solar simulators, which are the devices that provide illumination approximating natural sunlight. There are two types of simulators can be used as an irradiance source; steady state and flash simulator. Since steady state simulators provide continuous irradiation they can also provide the required heat for heating the PV module under test. On the other hand, flash type simulators since they have pulse type irradiations with a short pulse durations they have a quite low heating effect. Therefore, a different mechanism is needed to vary the temperature of the PV module to be measured. In this type of simulators in general an integrated thermal chamber can be used.
Besides the measurement conditions (constant irradiation and varying PV module temperature) there are some additional requirements when determining the temperature dependent electrical performance parameters of a PV module. These requirements can be listed as follows.
1. Solar Simulator System (Steady State / Flash):
According to the IEC 61215-2 standard, when a solar simulator system is used for determination of electrical parameters of a PV module it must have the following components and specifications:
a. The solar simulator system must have a light source such that in accordance with the specifications of IEC 60904-9 standard it’s spectral match, spatial non-uniformity of irradiance and temporal instability fulfill at least class BBB requirements.
b. The solar simulator system must have a calibrated PV reference device whose short-circuit current versus irradiance is determined in accordance with IEC 60904-2 or IEC 60904-6 standard requirements.
c. The solar simulator system must have a current - voltage (I-V) tracer for the measurements of electrical parameters (the short circuit current, Isc; the open circuit voltage, Voc; the maximum power, Pmax) of PV module. The current - voltage (I-V) tracer should be able to measure the current and voltage of the PV module with an accuracy of ± 0, 2 %.
1a. Steady-state solar simulators and natural sunlight
The temperature dependence measurement of the three main electrical parameters ISC, VOC, PMAX under steady-state irradiance conditions is performed by varying the temperature of the PV device while keeping the total irradiance level constant [2]. The latter has to be measured by a calibrated reference cell (RC) kept at 25 °C, because the resulting temperature coefficients (TCOs) of the device under test (DUT) refer to the irradiance level at which they have been measured.
When steady-state solar simulators or natural sunlight are used as light source, the heating component of the radiation can be used to naturally warm up the PV device by keeping it constantly exposed to light.
The usual procedure for measuring the temperature coefficients α (for ISC), β (for VOC) and δ (for PMAX) for large devices (from large-area cells to module size) is as follows:
- The PV device has to be prepared by cooling it down to a temperature below the lower limit of the range of interest.
- When the device is ready and temperature uniformity reached, it is connected to a setup suitable for I-V curve acquisition according to IEC 60904-1 [3] and exposed to steady-state artificial or natural sunlight.
- While the PV device is warming up due to incoming irradiance, a series of I-V curves are acquired in the same way as STC I-V curves would be recorded. Consecutive I-V curves are acquired at least every 5 °C for a total temperature range of at least 30K. The temperature of the DUT and of the RC is recorded together with the irradiance value and the I-V curve.
- Once the whole temperature range of interest is spanned and the I-V curve sequence is terminated, the three parameters ISC, VOC and PMAX are extracted from each I-V curve and the functions ISC(T), VOC(T), PMAX(T) are fit with a least-square linear fit [2]:
[math]\displaystyle{ Y(T) = m_{abs} \times T + Y_{0} }[/math] Eq. (1)
where mabs represents the absolute TCO, T is the measured DUT temperature and Y0 is the value of the parameter at 0 °C. The relative TCO is then calculated as [2]:
[math]\displaystyle{ m_{rel} = \frac { m_{abs} } { Y(25°C) } \times 100 }[/math] Eq. (2)
where Y(25 °C) is the value of the parameter Y at 25 °C as calculated from Eq. (1) and mrel is given in units of [%/°C] or [%/K].
When the DUT is a reference cell, a procedure similar in principle to the just-described one is applied, but usually with the addition of a temperature-controlled stage to be able to precisely control the temperature of the DUT through the range of interest. This allows variation of the method. Whereas above the DUT temperature is never in a steady-state condition, here such steady-state conditions can be adjusted. It allows further to measure the TCO with increasing temperatures or decreasing temperatures. For RCs only ISC(T) is measured instead of the full I-V curve dependence on T.
As the TCO measurement is ultimately a relative measurement, many components that would enter the UC budget for a standard measurement at STC are cancelled out. Therefore, the following issues can be considered major measurement uncertainty contributions for relative TCO measurements:
- DUT temperature: the major component of the UC budget comes from the reading of the DUT temperature. First of all, the value measured together with (and therefore associated to) the I V curve shall always be used, with a UC component (minor compared to what follows) related to the measuring instrument to be included. However, the most significant contributions to the DUT temperature UC are due mainly to the distance between the point at which the temperature is read by the Pt100 sensor and the actual position of the DUT junction, to the delay between the reading of the temperature and the sweep of the I-V curve and to the non-uniformity of the temperature in the DUT;
- RC temperature: even if actively controlled in temperature, the RC temperature contributes to the overall UC budget due to sequential reading with respect to the I-V curve sweep and to the UC related to the measuring instrument.
- Uncertainty related to linear fit: the standard error for the Y estimate from the linear-square fit is used as UC component for the computational part of the TCO determination.
- Uncertainty related to spectral mismatch: the change in the spectral responsivity with temperature and consequently spectral mismatch for certain materials (e.g. c Si) can be a significant contribution. For natural sunlight this contribution can be neglected in first order. For solar simulators it depends crucially on the match of their spectral irradiance to the reference spectrum in the wavelength range where the spectral responsivity of the DUT is most sensitive to temperature changes (i.e. for c-Si the wavelength range between 900 nm – 1200 nm). The full uncertainty can only be calculated if the SR as function of temperature is available for the DUT. In absence of this information, such data for typical devices similar to the DUT can be used to estimate the UC contribution.
[2] IEC, IEC 60891 Photovoltaic devices – Procedures for temperature and irradiance corrections to measured IV characteristics., International Electrotechnical Commission, 2009
[3] IEC, IEC 60904-1 Photovoltaic devices – Part 1: Measurement of photovoltaic current-voltage characteristics, International Electrotechnical Commission, 2006
1b. Flash solar simulators
The measurement of the temperature coefficients by using a flash solar simulator is similar to the previous method. However, as the irradiance produced by the light source is not enough to warm up the DUT, an additional heating system is necessary in order to vary the DUT temperature over the range of interest. Suitable means are an insulated temperature-controlled cabinet with a transparent window or a shutter door, capable of containing the module and producing a quasi-steady and uniform temperature on it. According IEC 60891(2009) [2] the temperature uniformity of the DUT has to be within ±2 °C and has to be verified for large devices by the mean of a minimum of 4 temperature measurements positioned as described in the standard. The average temperature is used as reference value.
The procedure to measure DUT TCOs is as follows:
- The PV device is mounted on a setup suitable for I-V curve acquisition according to IEC 60904-1 [3] and brought to the lowest temperature of the range of interest. If a temperature-controlled box is used, the RC is mounted on the outside, to be kept at 25 °C. Also, a calibration of the transmittance of the transparent door of the box has to be always carried out at the beginning of the TCO measurements.
- When the device is ready and its temperature deemed stable, at least three I-V curves are acquired.
- The DUT temperature is then varied by the chosen method. Additional I-V curves are acquired at least every 5 °C for a total temperature range of at least 30 °C. The temperature of the DUT and of the RC is recorded together with the irradiance value and the I-V curve.
- Once the whole temperature range of interest is spanned and the I-V curve sequence is terminated, the three parameters ISC, VOC and PMAX are extracted from each I-V curve and the functions ISC(T), VOC(T), PMAX(T) are fit with a least-square linear fit [2] according to Eq. (1). The relative TCO is then calculated according to Eq. 2 [2].
The following issues can be considered major measurement uncertainty contributions for measurements at flash solar simulators:
- DUT temperature: the major component of the UC budget comes from the reading of the DUT temperature. First of all, the value measured together with (and therefore associated to) the I V curve shall always be used, with a UC component (minor compared to what follows) related to the measuring instrument to be included. However, the most significant contributions to the DUT temperature UC are due mainly to the distance between the point at which the temperature is read by the Pt100 sensor and the actual position of the DUT junction and to the delay between the reading of the temperature and the sweep of the I-V curve. In the case of flash solar simulators, though, the non-uniformity of the DUT temperature is not influenced by the simulated sunlight. If the procedure achieves a good temperature uniformity of the DUT, this will be a minor component of the overall UC.
- RC temperature: even if actively controlled in temperature, the RC temperature contributes to the overall UC budget due to sequential reading with respect to the I-V curve sweep and to the UC related to the measuring instrument.
- Uncertainty related to linear fit: the standard error for the Y estimate from the linear-square fit is used as UC component for the computational part of the TCO determination.
- Uncertainty related to spectral mismatch: as for TCO measurements under steady-state simulated sunlight.
2. Differential spectral responsivity method
The determination of the temperature coefficient for the short circuit current at standard test conditions of a solar cell (SC) can be derived from temperature dependent measurements of the spectral irradiance responsivity sSTC(λ) using the differential spectral responsivity (DSR) method [1, 2] since the short circuit current ISTC is linked to the spectral responsivity sSTC(λ) and the spectral irradiance EAM1.5g(λ) via the following equation:
[math]\displaystyle{ I_{STC} = \int s_{STC}(\lambda) \cdot E_{AM1.5G}(\lambda)d\lambda }[/math]
A differential spectral responsivity (DSR) facility generally consists of a quasi-monochromatic light source providing narrowband monochromatic irradiance in the wavelength regime of the device under test, i.e. for c-Si solar cells from 280 nm – 1200 nm. In this monochromatic light field, the device under test (DUT) is compared against a calibrated reference, wavelengths by wavelength. Additionally, the device under test is exposed to broadband white light bias irradiance usually generated by cold mirror halogen lamps. In order to separate the photocurrent of the DUT generated by the monochromatic light and the bias light, the monochromatic light is chopped with a given frequency and the lock-in technique is applied. Since usually the DUT and the reference are measured subsequently a drift of the monochromatic irradiance between these two measurements have to be corrected for. Hence a fraction of the monochromatic light is coupled onto a monitor device, i.e. a photodiode.
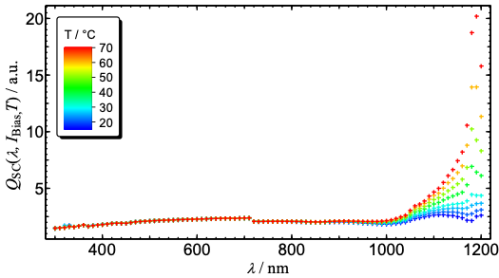
Since a complete DSR calibration at several different temperatures can be very time consuming, such a measurement can be divided into a standard calibration of the spectral responsivity in order to determine sSTC(λ) and a temperature dependent measurement of the relative differential spectral responsivity s̃SZ(λ,T,IBias) by means of the measurement of the monitor corrected Lock-In signal of the solar cell at constant bias irradiance level EBias and at different temperature QSC(λ,T,IBias).
According to IEC 60904-8:2014 7.5 [2] the spectral responsivity sSTC(λ) can be assumed to be equal to the differential spectral responsivity s̃SZ(λ,IBias), if IBias is approximately 30% - 40% of ISTC. Hence the temperature dependent measurements of the relative differential spectral responsivity are performed at IBias ≈ 0.35*ISTC. The measurement procedure would be as follow
Measurements of the monitor corrected Lock-In signal of the solar cell at constant bias irradiance level EBias at different temperatures QSC(λ,T,IBias) using the differential spectral responsivity method. An example for a crystalline silicon solar cell is shown in the figure below. Please note that the monitor principle is essential for this measurement, since lack of reproducibility is a major uncertainty contribution for such a relative measurement.
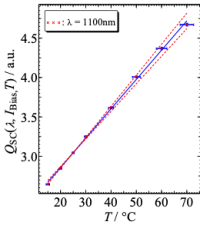
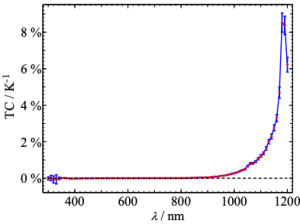
Perform a linear regression of the temperature dependent differential responsivity of the solar cell at every single wavelength (see Figure below left). The slope corresponds to the spectral temperature coefficient. Express this function TC(λ) in units of [1/K]. An example for a crystalline silicon solar cell is shown in the figure below right.
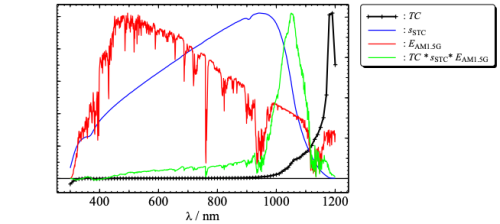
Weighting the spectral temperature coefficient TC(λ) with the spectral responsivity sSTC(λ) and the spectral irradiance of the AM1.5G spectrum EAM1.5G(λ) gives the temperature coefficient α of the short circuit current under STC.
[math]\displaystyle{ \alpha = \int_{}^{} \frac { \int_{}^{} TC(\lambda) \cdot s_{STC}(\lambda) \cdot E_{AM1.5G}(\lambda)d\lambda } { \int s_{STC}(\lambda) \cdot E_{AM1.5G}(\lambda)d\lambda } }[/math]
The major uncertainty contributions for such a measurement are:
- Spectral responsivity: The spectral responsivity of the DUT is needed for the calculation of α out of the spectral TC. Please note, that only the relative sSTC(λ) is needed. Hence all uncertainties related to the absolute value of sSTC(λ) can be neglected.
- Over illumination of sample and reference: The monochromatic light field should be larger than the active area of the solar cell. This includes encapsulation materials, since light transmission and reflection characteristics of encapsulation material might be temperature dependent.
- Monitor principle: Since the DUT is subsequently measured at different temperature, a drift of the monochromatic irradiance over that period should be corrected for. This can be realized by coupling a fraction of the monochromatic light onto a monitor detector (e.g. by using a beam splitter)
- Reproducibility: The reproducibility is a key uncertainty contribution. The non-uniformity of the monochromatic light field, the center wavelength of the monochromatic light and the bias irradiance level should be reproducible to a high degree for the temperature dependent measurements.
- Temperature: The DUT should be stabilized with respect to the set temperature. Deviation from the set temperature should be considered in the uncertainties. If the temperature sensor is in direct thermal contact to the DUT, additional uncertainties should be included (i.e. if a temperature gradient can be expected across the solar cell: backside cooling – temperature sensor – solar cell – encapsulant – front side heat load due to irradiation).
- Uncertainty related to linear regression: The uncertainties U(T) and U(QSC(λ,T,IBias)) should be used as weights for the linear regression for the determination of TC(λ). The uncertainty of TC(λ) should be derived from the linear regression considering U(T) and U(QSC(λ,T,IBias)).
[1] Metzdorf et al. “Calibration of solar cells. 1: The differential spectral responsivity method”, Applied Optics Vol. 26 No. 9, 1987
[2] IEC 60904-8:2014, Measurement of spectral response of a photovoltaic (PV) device (2014)
3. Thermal Chamber:
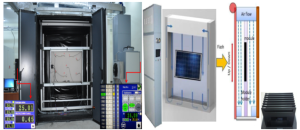
The thermal chamber is needed for changing the temperature of PV module under the test. This unit is only needed for flash type simulators, since the steady state simulator’s radiation sources have heating effect which can be used for heating the PV module. If a thermal chamber is needed to be used with a flash type simulators according to the IEC 60891 standard it must have following accessories and technical specifications:
a. heating and cooling components for controlling the temperature of the PV module by air flow over the required temperature range.
b. A module holder such that its mounting blocks are not be thermally conductive.
c. Temperature sensors for controlling the temperature uniformity inside the chamber.
d. At least four temperature sensors attaching to the back side of PV module for measuring the temperature uniformity over the surface of PV module. Each temperature sensor must have accuracy of ± 1 0C and repeatability of ± 0,5 0C.
Procedure for the measurements of temperature dependent electrical parameters of PV modules
In IEC 60891 standard three methods are defined for the determination of temperature coefficients. In this document the interpolation method, which contrary to first two methods does not need any correction parameters as input, is described. According to the IEC 60891 standard in order to implement interpolation methods, the short circuit current, open circuit voltage and maximum power performance parameters of PV modules have to be measured at a range of temperature at least 30 °C in steps of approximately 5 °C. Then by plotting the performance parameters versus temperature and taking the slopes of these parameters the temperature coefficients can be determined. The procedures for these processes are described as follows:
a. PV module should be mounted to the module holder
b. To record the temperature distribution of PV module, at least four (4) temperature sensors should be mounted to the back side of PV module. These sensors have to be attached directly behind the cells.
c. The electrical output of PV module should be connected to the I-V tracer of simulator.
d. If a steady state simulator is used, for heating the PV module the irradiance level has to be set to a specific value at this stage. For the flash type simulators this can be done after heating process. If a flash type simulator is used, for heating the PV module a thermal chamber need to be used. For this;
· All the doors of thermal chamber must be closed for the heating and cooling the PV module.
· In setting the temperature, it is recommended to set the temperature starting from the lowest temperature value. After setting the temperature inside the thermal chamber wait until the desired temperature stability is achieved.
e. By recording the temperature values at each point the temperature non uniformity has to be evaluated and compared with the IEC 60891 standard requirements (±2 0C). If the calculated non uniformity is less than the standard requirement, then the PV module can be irradiated and the measurements of it’s the electrical performance parameters can be performed.
f. The heating and the measurements of electrical performance parameters should be continued at each 5 °C increments of the PV module temperature for 30 °C temperature range.
g. By acquiring the I-V curves of the module at different temperatures, the temperature dependent values of short circuit current, open circuit voltage and the maximum power can be extracted
h. From the temperature dependent graphs after a least-square linear fit evaluate the slopes using Eqns2.
α = ΔIsc d/ΔT (A/0C) (2.a)
β = ΔVoc d/ΔT (V/0C) (2.b)
Κ = ΔPmax d/ΔT (W/0C) (2.c)
These are absolute temperature coefficients for short-circuit current, the open-circuit voltage and the maximum power respectively. In the data sheets of PV modules in general relative temperature coefficients are given. To convert these temperature coefficients into relative temperature coefficients, any variations in the short-circuit current, the open circuit voltage and the maximum power within the temperature interval are respectively divided by the short circuit current, the open circuit voltage and the maximum power values obtained at STC (Eqns3).
α = 100 • (ΔIsc /Isc)/ΔT (%/0C) (3.a)
β = 100 • (ΔVoc/Voc)/ΔT (%/0C) (3.b)
Κ = 100 • (ΔPmax /Pmax)/ΔT (%/0C) (3.c)
Table 2: Temperature coefficients of electrical parameters of PV module
| Electrical Parameters | Temperature Coefficients | Values |
| Short Circuit Current ,Isc (A) | α | a (%/0C) |
| Open Circuit Voltage ,Voc (V) | β | b (%/0C) |
| Maximum Power , Pmax (W) | κ | c (%/0C) |
Using these parameters in the translation equations given Eqn (1), along with the STC values, the electrical parameters of a PV module can be calculated at different temperatures.
Measurements with a flash solar simulator – Case study
In this section, a case study is carried out to demonstrate typical measurements of the temperature dependent performance of the electrical parameters of the PV module and to calculate its temperature coefficients using a flash type solar simulator measurement system. In order to perform the measurements and to make the calculations correctly, all the stages mentioned in Section 3 which is prepared according to the relevant standards must be fully applied. The procedure for measurements and temperature coefficients using pulse type solar energy simulator is as follows:
· The PV module is mounted to the module holder as shown Figure 1a
· Temperature sensors were mounted to the back side of PV module.
· The outputs of PV module are connected to the I-V tracer of simulator.
· All the doors of thermal chamber are closed
· The thermal chamber is turned on and the temperature was set at 20 0C
· After the desired temperature stability was achieved temperature values from each sensors were recorded (Table 1, Row 1).
Table 1: Temperature distribution over PV module surface
| T1
(°C) |
T2
(°C) |
T3
(°C) |
T4
(°C) |
Tmax-Tmin
(°C) |
Std Req (°C) |
| 20,7 | 20,2 | 20,3 | 20,3 | 0,50 | ±2 |
| 25,9 | 25,3 | 25,8 | 25,6 | 0,60 | ±2 |
| 29,9 | 29,5 | 29,6 | 30,0 | 0,49 | ±2 |
| 34,5 | 34,1 | 34,3 | 34,6 | 0,49 | ±2 |
| 40,4 | 39,8 | 40,0 | 40,2 | 0,60 | ±2 |
| 45,3 | 44,8 | 44,9 | 45,0 | 0,50 | ±2 |
| 50,4 | 49,9 | 49,5 | 50,0 | 0,95 | ±2 |
· Temperature non-uniformity was evaluated and compared with the IEC 60891 standard requirements (±2 0C).
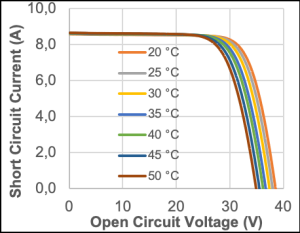
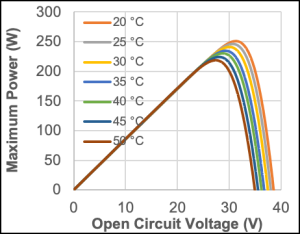
· I-V and P-V curves we recorded as shown in Figure 2
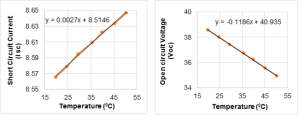
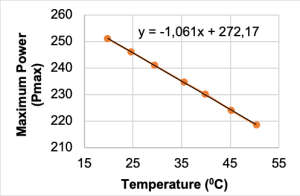
The above process was repeated for 5 °C increments of the PV module temperature until a 30 °C temperature range covered. From the curves above the temperature dependent values of short-circuit current, open-circuit voltage and the maximum power values were obtained. Graphs of short circuit current versus temperature, the open circuit voltage versus temperature and the maximum power versus temperature are presented in Figures 3 and 4.
Table 2: Performance parameters of PV module as a function of temperature
| Module Temperature (°C) | Open Circuit Voltage ,Voc (V) | Short Circuit Current ,Isc (A) | Maximum Power Pmax (W) |
| 19,81 | 38,5656 | 8,5656 | 250,9444 |
| 24,63 | 38,0212 | 8,5789 | 246,0843 |
| 29,40 | 37,4491 | 8,5951 | 241,0297 |
| 35,52 | 36,7381 | 8,6096 | 234,5884 |
| 39,83 | 36,2346 | 8,6223 | 230,2024 |
| 45,21 | 35,5652 | 8,6337 | 224,1263 |
| 50,37 | 34,9455 | 8,6470 | 218,5295 |
From the temperature dependent graphs after a least-square linear fit the slopes were evaluate as follows.
α=ΔIsc/ΔT (A/0C )= (5,6470-8,5656)/ (50,37-19,81) = 0,0027
β=ΔVoc/ΔT (V/0C) = (34,9455-38,5656)/ (50,37-19,81) = -0,1185
κ=ΔPmax/ΔT (W/0C) =(218,530-250,944)/ (50,37-19,81) = -1,061
These are absolute temperature coefficients for short-circuit current, the open-circuit voltage and the maximum power respectively. These temperature coefficients can be converted into relative temperature coefficients:
α=(100*ΔIsc/Isc)/ΔT (%/0C) = ((5,6470-8,5656)/ 8,5779)/(50,37-19,81)= 0,03
β=(100*ΔVoc/ Voc)/ΔT (%/0C) =((34,9455-38,5656)/38,0212)/(50,37-19,81) = -0,31
κ=(100*ΔPmax/Pmax)/ΔT (%/0C) =(218,530-250,944)/246,084)/(50,37-19,81) =-0,43
Table 3: Temperature coefficients of electrical parameters of PV module
| Electrical Parameters | Temperature Coefficients | Values |
| Short Circuit Current ,Isc (A) | α | 0,03 (%/0C) |
| Open Circuit Voltage ,Voc (V) | β | -0,31 (%/0C) |
| Maximum Power , Pmax (W) | κ | -0,41 (%/0C) |
Using these parameters in the translation equations given Eqn1, along with the STC values the electrical parameters of a PV module can be calculated at different temperatures.
For T= 10 0C
Isc,c = Isc [1 + α(T2 – T1)]
Isc(10 0C) = 8,5789*[1+(0,03/100)*(24,63-10)] = 8,5412 A
Voc,c = Voc [1 + β(T2 – T1)]
Voc(10 0C) = 38,0212*[1+(-0,31/100)*(24,63-10)] = 39,7456 V
Pmax,c = Pmax [1 + κ(T2 – T1)]
Pmax(10 0C) = 246,084*[1+(-0,41/100)*(24,63-10)] = 260,85 W
For T= 50 0C
Isc,c = Isc [1 + α(T2 – T1)]
Isc(50 0C) = 8,5789*[1+(0,03/100)*(24,63-50)] = 8,6442 A
Voc,c = Voc [1 + β(T2 – T1)]
Voc(50 0C) = 38,0212*[1+(-0,31/100)*(24,63-50)] = 35,0309 V
Pmax,c = Pmax [1 + κ(T2 – T1)]
Pmax(50 0C) = 246,084*[1+(-0,41/100)*(24,63-50)] = 240,49 W
REFERENCES
IEC 60891, Photovoltaic devices – Procedures for temperature and irradiance corrections to measured I-V characteristics
IEC 61215-2, Terrestrial photovoltaic (PV) modules - Design qualification and type approval - Part 2:Test procedures
IEC 60904-9, Photovoltaic devices – Part 9: Solar simulator performance requirements
IEC 60904-10, Photovoltaic devices – Part 10: Methods of linearity measurement
IEC 60904-2, Photovoltaic devices – Part 2: Requirements for photovoltaic reference devices
