Help
File list
Jump to navigation
Jump to search
This special page shows all uploaded files.
File list
Items per page:
20
50
100
250
500
Search for media name:
Username:
Include old versions of files
Go
First page
Previous page
Next page
Last page
Date
Name
Thumbnail
Size
User
Description
Versions
11:57, 29 March 2023
Shading Fig 5.png
(
file
)
4 KB
Paul K
1
11:58, 29 March 2023
Shading Fig 6.png
(
file
)
5 KB
Paul K
1
16:34, 28 January 2022
Figure 2- Differential spectral responsivity of the reference solar cell (coloured) as well as its spectral irradiance responsivity at STC (dashed). .png
(
file
)
8 KB
Stefan Winter, PTB (Admin)
1
16:36, 28 January 2022
Figure 4- Spectral temperature coefficient of the reference solar cell. .png
(
file
)
13 KB
Stefan Winter, PTB (Admin)
1
16:35, 28 January 2022
Figure 3- This graph shows the AM1.5g weighted DSR dependent on the bias current i.e. the bias irradiance level. This graph indicates that the non-linearity of the reference solar cell is less than 0.1%..png
(
file
)
15 KB
Stefan Winter, PTB (Admin)
1
13:14, 26 September 2022
Energy Rating Fig 3 Unten.gif
(
file
)
18 KB
Paul K
1
13:13, 26 September 2022
Energy Rating Fig 3 Oben.gif
(
file
)
19 KB
Paul K
1
14:39, 22 September 2022
Comparison Fig 5.jpg
(
file
)
19 KB
Paul K
1
10:34, 9 May 2022
04 02.png
(
file
)
21 KB
Paul K
1
14:35, 22 September 2022
Comparison Fig 1.jpg
(
file
)
22 KB
Paul K
1
10:35, 9 May 2022
04 03.png
(
file
)
22 KB
Paul K
1
14:23, 22 September 2022
Optical Fig 5a.png
(
file
)
23 KB
Paul K
1
14:26, 22 September 2022
Optical Fig 6.jpg
(
file
)
23 KB
Paul K
1
14:37, 22 September 2022
Comparison Fig 2.jpg
(
file
)
23 KB
Paul K
1
13:37, 22 September 2022
05 Figure 1.png
(
file
)
23 KB
Paul K
1
14:40, 22 September 2022
Comparison Fig 6.1.jpg
(
file
)
24 KB
Paul K
1
14:20, 22 September 2022
Optical Fig 5.png
(
file
)
24 KB
Paul K
1
14:40, 22 September 2022
Comparison Fig 6.2.jpg
(
file
)
24 KB
Paul K
1
22:14, 13 February 2022
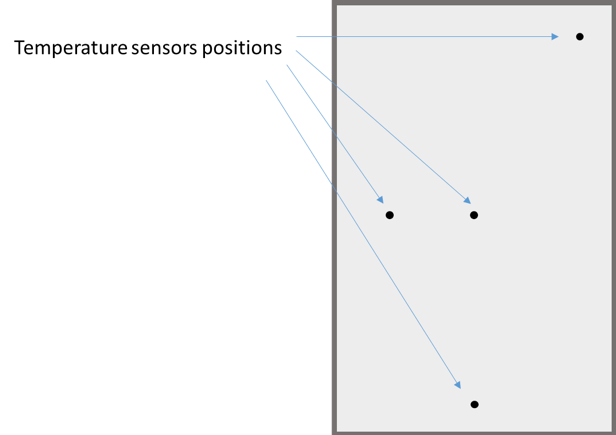
Figure 5- Positions for measuring the temperature of the test module behind the cells.png
(
file
)
26 KB
Paul K
1
14:19, 22 September 2022
Optical Fig 4.jpg
(
file
)
26 KB
Paul K
1
14:38, 22 September 2022
Comparison Fig 3.jpg
(
file
)
27 KB
Paul K
1
22:14, 13 February 2022
Figure 6- Schematic of bifacial PV module and the required non-irradiated background and aperture.png
(
file
)
31 KB
Paul K
Schematic of bifacial PV module and the required non-irradiated background and aperture
1
22:14, 13 February 2022
Figure 4- Performance parameters of PV module as a function of temperature; a- Maximum Power versus temperature.png
(
file
)
31 KB
Paul K
1
11:56, 29 March 2023
Shading Fig 4.png
(
file
)
32 KB
Paul K
1
14:48, 8 December 2023
Fig 8 Indoor PV.png
(
file
)
32 KB
Paul K
1
14:48, 8 December 2023
Fig 9 Indoor PV.png
(
file
)
32 KB
Paul K
1
10:34, 9 May 2022
04 01.png
(
file
)
34 KB
Paul K
1
14:38, 22 September 2022
Comparison Fig 4.jpg
(
file
)
35 KB
Paul K
1
11:59, 20 May 2022
06 Figure 3.png
(
file
)
37 KB
Paul K
1
11:56, 29 March 2023
Shading Fig 3.png
(
file
)
37 KB
Paul K
1
14:48, 8 December 2023
Fig 7 Indoor PV.png
(
file
)
38 KB
Paul K
1
13:49, 24 April 2022
BlogFoto14.jpg
(
file
)
41 KB
Paul K
1
13:02, 26 September 2022
Current Fig 5b.png
(
file
)
43 KB
Paul K
1
12:59, 26 September 2022
Current Fig 4.png
(
file
)
43 KB
Paul K
1
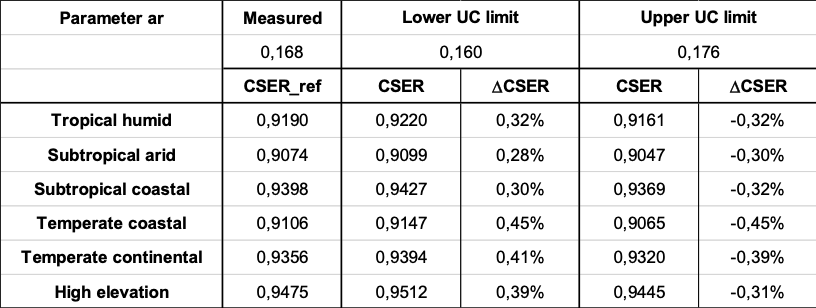
20:07, 15 February 2024
Table 8 Uncertainty of PV Module Energy Rating.png
(
file
)
46 KB
Paul K
1
22:14, 13 February 2022
Figure 3- Schematic of the experimental layout for angular response measurements of small samples.png
(
file
)
47 KB
Paul K
1
12:03, 20 May 2022
06 Figure 6.2.png
(
file
)
47 KB
Paul K
1
13:07, 26 September 2022
Current Fig 2.png
(
file
)
48 KB
Paul K
1
10:26, 2 May 2022
Blog03 Figure 2.png
(
file
)
48 KB
Paul K
1
10:35, 9 May 2022
04 04.png
(
file
)
49 KB
Paul K
1
22:14, 13 February 2022
Figure 4- Schematic of setup configuration for angular response measurement of a tilted PV module with 3 bypass diodes (left) and the resulting measured I-V characteristic (right) .png
(
file
)
49 KB
Paul K
1
13:01, 26 September 2022
Current Fig 5a.png
(
file
)
50 KB
Paul K
1
13:48, 24 April 2022
BlogGrafik10.png
(
file
)
50 KB
Paul K
1
22:14, 13 February 2022
Figure 1- Schematic description of the equivalent irradiance (GE) method.png
(
file
)
51 KB
Paul K
Schematic description of the equivalent irradiance (GE) method
1
22:14, 13 February 2022
Figure 2.1- Performance parameters of PV module as a function of temperature; a- Short-circuit current versus open-circuit voltage, b- maximum power versus open-circuit voltage.png
(
file
)
52 KB
Paul K
1
14:57, 8 December 2023
Fig 30 Indoor PV.png
(
file
)
52 KB
Paul K
1
13:49, 24 April 2022
BlogGrafik12.jpg
(
file
)
53 KB
Paul K
1
11:55, 29 March 2023
Shading Fig 2.png
(
file
)
53 KB
Paul K
1
14:45, 8 December 2023
Fig 1 Indoor PV.png
(
file
)
54 KB
Paul K
1
22:14, 13 February 2022
Figure 2.2- Performance parameters of PV module as a function of temperature; a- Short-circuit current versus open-circuit voltage, b- maximum power versus open-circuit voltage.png
(
file
)
54 KB
Paul K
1
First page
Previous page
Next page
Last page
Navigation menu
Personal tools
Create account
Log in
Namespaces
Special page
Variants
Views
More
Search
Navigation
Main page
Recent changes
Random page
Help about MediaWiki
Tools
Special pages
Printable version


_as_well_as_its_spectral_irradiance_responsivity_at_STC_(dashed)._.png)


_and_the_resulting_measured_I-V_characteristic_(right)_.png)


_method.png)


