Graph of Pmax as a function of GR, for calculation of the BiFi parameter, by the slope of the linear fit line for the measured points. The line is forced to intercept the point (0, Pmax(STC))
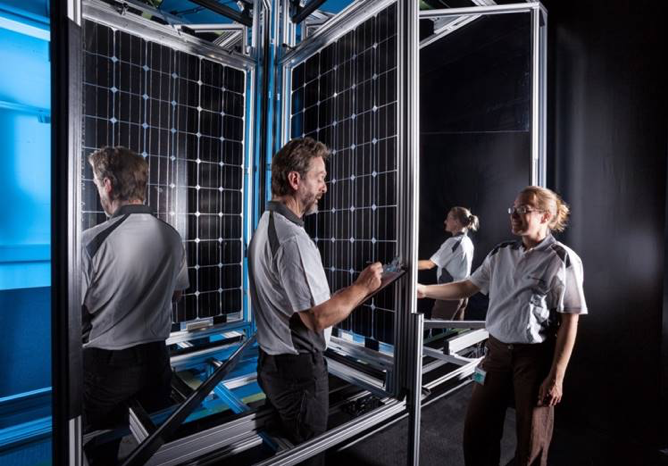
Unit for contacting the front of silicon solar cells. Current and voltage contact pins are electrically isolated from each other to enable four-wire measurements
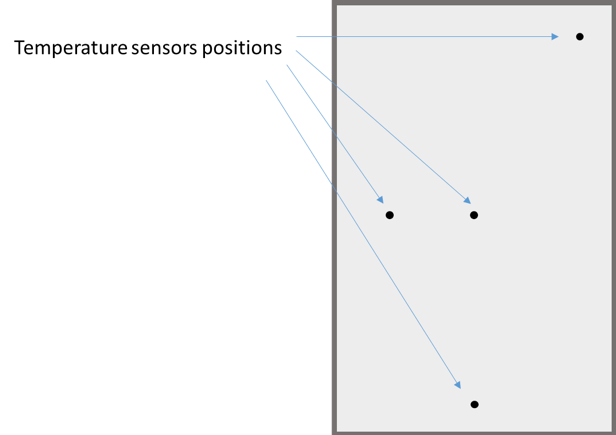
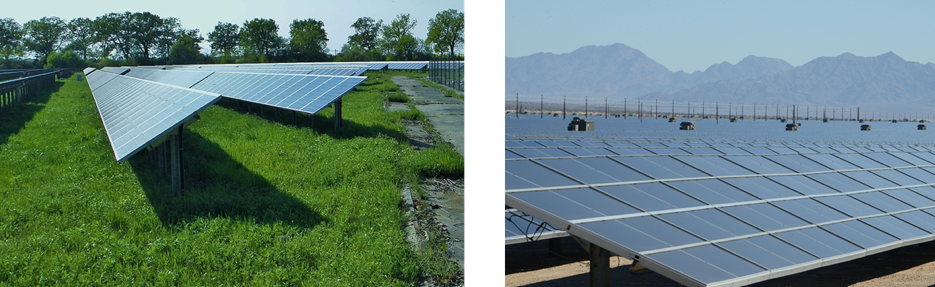
Picture of one of the outdoor measurement facilities of the European Solar Test Installation (ESTI) located at the Joint Research Centre (JRC) in Ispra, Italy. A reference solar cell is installed over the module to record the incoming irradiance. The temp


).png)


_and_the_resulting_measured_I-V_characteristic_(right)_.png)


_method.png)
_located_at_the_Joint_Research_Centre_(JRC)_in_Ispra,_Italy.png)
-_Solar_Simulator,_(b)-_Thermal_Chamber,_(c)-_Attenuation_masks.png)


_as_well_as_its_spectral_irradiance_responsivity_at_STC_(dashed)._.png)


