Primary calibration methods
Ingo Kroeger
Calibration procedures of a reference cell
In principal there are 4 different procedures to calibrate reference solar cells:
a) The direct sunlight method
b) The global sunlight method
c) The Differential spectral responsivity method
d) The solar simulator method
All 4 methods can be conducted as primary or as secondary calibration methods, dependent on the reference applied. A description of these 4 methods can be found in IEC standard 60904-4 [4]. Follow the links above to get briefly summarized descriptions.
Case study: example reference cell, characteristics, calibration
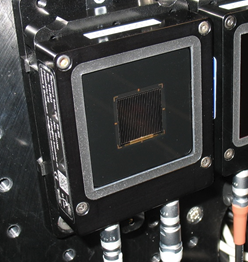
A good example for a reference solar cell is shown in Figure 1. In the centre there is a 2x2 cm² solar cell made from mono-crystalline float zone silicon encapsulated with a durable glass window. The solar cell is electrically connected to female LEMO connected to the bottom. On the left side of the housing there is the printed ID as well as the name of the manufacturer and are marking of the physical position of the cell within the housing.
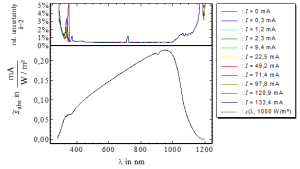
The coloured graphs in Figure 2 show the absolute differential spectral responsivity (DSR) of this reference solar cell. These curves have to be taken, if the reference device is used as a reference for a DSR facility measuring the DSR of a DUT.
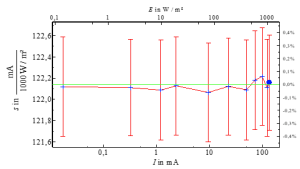
The spectral irradiance responsivity (SR) is shown as dashed line. The SR drops to zero at 280 nm and at 1200 nm. The short circuit current of this cell is 122,14 mA. This SR curve has to be taken for the spectral mismatch correction if this reference device is used as a reference for a solar simulator measuring the short circuit current of a DUT. The irradiance level of the solar simulator has to be adjusted to the short circuit current of this reference. The non-linearity of the device is better than 0.1 % as shown in Figure 3.
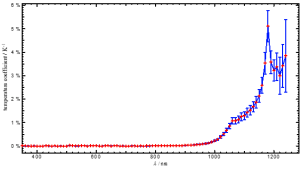
Figure 4 shows the spectral temperature coefficient of this silicon reference solar cell. This graph shows the percentage change of the spectral responsivity per Kelvin temperature difference from 25°C. This correction has to be applied to the spectral responsivity, if the reference cell is operated at different temperatures. A weighting of this function with the SR of the device and the AM1.5g spectrum leads to a temperature coefficient of the short circuit current of 680 ppm/K. This correction has to be applied to the short circuit current, if the reference cell is operated at different temperatures.
References
[4] IEC 60904-4:2009, Photovoltaic devices - Part 4: Reference solar devices - Procedures for establishing calibration traceability


