Development of a shading resistance metric for solar modules
Hendrik Sträter, Stefan Riechelmann, Stefan Winter.
Figure 1: Different shading situations on a rooftop PV power plant.
With increasing awareness of the problems caused by shading of PV modules, various strategies have been developed to increase the shading resistance of PV systems. The shading resistance of a PV system can be improved at the design stage and at the inverter level, or by using individual power optimisers connected directly to individual PV modules. At the PV module level, certain technologies have also been developed, such as adding bypass diodes, shingled solar cells or the division of the module into sub-modules connected in parallel.
It is understandable that innovative module designs are promoted for their improved shading resistance. However, comparing different module technologies and designs becomes difficult when shading resistance is not well defined as a property of a PV device and there are no standardised means of testing a PV module for its shading resistance compared to common technologies.
In our Metro-PV project, we are currently developing a classification scheme for better comparison of the shading resistance of typical PV modules. We have designed the scheme to be quick and easy to implement and to cover only the most relevant shading scenarios.
The Classification Scheme
We evaluated a classification scheme that evaluates the power loss of a PV module under different shading patterns, where the power loss is determined solely by the shaded area of the PV module. Ideally, the loss of power would be equal to the size of the shaded area, e.g. if 20 % of the module area is shaded, a perfectly shading resistant device would is expected to loose only 20 % in terms of module power. In most cases, the Power Loss (PL) is larger than the Expected Loss (EL), Additional Loss (AL) is occuring due to the circuit design of the PV module. The relation between AL, PL and EL is shown in Figure 2.
Figure 2: Relation between actual Power Loss (PL), Expected Loss (EL) and resulting Additional Loss (AL).
Now having a definition for the rating, we define suitable shading scenarios that shall be rated. We consider three different stationary shading patterns:
- 25 cm wide shading along the long side of the PV module
- 25 cm wide shading along the short side of the PV module
- 9 cm x 3 cm sized spot shading within a cell of the PV module
The scenarios are shown in Figure 3. Many more shading patterns have been discussed and evaluated for their impact, but could be reduced to the proposed patterns. Shading exactly one row of cells was also discussed, but this would not be an objective comparison as in reality the size of a shade does not vary with the cell technology used. The aim here was to shade at least one row of cells and, taking into account M12 size cell designs, 25 cm was chosen for this purpose. The size of the shading spot in the partial shading scenario is chosen so that it can also cover rectangular shingle cells in such a way that only one particular cell is covered.
Figure 3: Typical shading patterns on a standard 60-cell PV module shown as short side (top left), long side (top right) and spot shading (bottom left). Dark red cells are fully shaded, blue areas are not affected by shading and light red areas are partially shaded. For larger modules, the shading material would only be adjusted in length to shade the module over its entire length and width. The width of the shade is kept constant.
To complete the metric, we need an appropriate classification. We propose categories of different additional losses AL ranging from class A to class D as shown in Figure 4.
Figure 4: Classification scheme for the shading resistance depending on the Additional Loss AL.
Shading Material
We used opaque black PVC material measuring 200 cm × 25 cm and 120 cm × 25 cm for shading along the long and short sides, and a 9 cm × 3 cm polished aluminium strip for spot shading. The use of PVC for spot shading is not recommended as the solar cell can heat up significantly and deform the shading material. The shading material has been applied precisely to the edges of the PV module.
The Metric in Practice
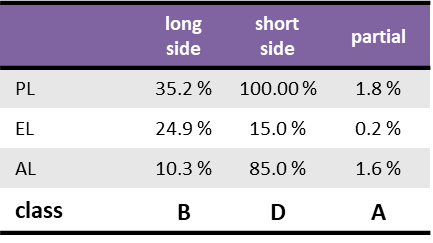
Let us illustrate the classes using the well-known full-cell module with three bypass diodes. We have applied the proposed shading patterns to a full-cell module and obtained the results shown in Figure 5: covering the long side results in an additional loss of 10.3 %, which would correspond to Class B. Covering the short side of a full-cell PV module results in a very high power loss of 100 %, which corresponds to an additional loss of 85% and thus only reaches Class D. Covering a cell with the proposed spot shade pattern results in a very small AL of 1.6 %, yielding Class A in this category. So a full cell PV module like the one examined will be classified as BDA in terms of shading resistance.
Figure 5: Classification results of a full cell PV module.
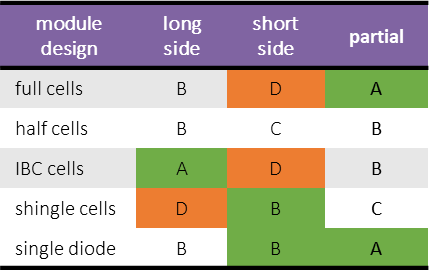
So far, we have tested various PV modules with different circuit designs, such as half-cell, shingle and single diode modules. The results of these particular modules under test are shown in Figure 6. There are certain module types that are known to perform poorly in certain shading patterns, so the poor performance of a full cell module when shaded on its short side is not surprising. Other performances, such as the Class D of the shingle module examined, were not apparent to us beforehand, demonstrating the value of such classification. Also, some module technologies tend to show a greater variation in circuit design, especially the number of bypass diodes used in certain shingle module fabrications, leading to better performance in individual categories.
Figure 6: Classification results of different modules tested by PTB.
Outlook
Right now, several labs are testing the proposed metric under solar simulator and natural sunlight illumination on identical PV modules to check the robustness of the results.
Literature
Sträter, H.; Riechelmann, S.; Winter, S. (2019): An Approach for a Shading Resistance Classification of PV Modules. 8th World Conference on Photovoltaic Energy Conversion; 492 – 497. DOI: 10.4229/WCPEC-82022-3BO.12.5


