Spectral Irradiance of Solar Simulators
Authors: C. Schinke (ISFH), D. Hinken (ISFH), I. Kröger (PTB)
The application of spectral mismatch corrections in solar cell calibrations according to the IEC 60904 standard series requires measuring the spectral irradiance distribution of the solar simulator used for this purpose. Accordingly, many laboratories routinely operate spectrometers for the acquisition of spectral irradiance data, and a variety of different instruments are in use. Array spectrometers are frequently chosen for this purpose due to their compactness and their ability to acquire the spectral irradiance over a wide wavelength range within just a few seconds. However, the measured spectral irradiance distribution is influenced by several effects that eventually require a correction. Recent intercomparisons of solar spectral irradiance measurements between different laboratories show deviations of the order of 10%1,2, emphasizing the need for a thorough analysis of the measured data in order to facilitate a correct interpretation. Such an analysis is supported by substantiated estimates of the measurement uncertainty. In this article, we give an overview of the measuring procedure for determining the spectral irradiance of solar simulators and the corresponding measurement uncertainty analysis. The article is based on the publication "Calibrating Spectrometers for Measurements of the Spectral Irradiance caused by Solar Radiation" (Schinke et al., Metrologia (2020), DOI: 10.1088/1681-7575/abafc5, open access), where further details can be found and from which the figures in this article are taken.
1. MEASURING PROCEDURE
Determining the spectral irradiance of solar simulators EDUT(λ) (DUT: device under test) usually requires two measurements: First, the radiometric correction function
[math]\displaystyle{ K(\lambda) = \frac {E_{ref}(\lambda)} {S_{ref}(\lambda)} }[/math]
for the spectrometer is determined by measuring the known spectral irradiance Eref(λ) of a reference lamp, which leads to a detector signal Sref(λ) (usually in digital counts or digital counts per time). Second, the spectral irradiance of the solar simulator is obtained via
[math]\displaystyle{ E_{DUT}(\lambda) = S_{DUT}(\lambda) K(\lambda) }[/math]
where SDUT(λ) denotes the spectrometer signal when the measuring head is illuminated by the solar simulator. Both reference and DUT measurement may require corrections regarding
1. The internal background (dark signal) of the spectrometer and external stray light (from the surrounding),
3. Detector nonlinearity effects,
4. Internal (spectral) stray light,
5. Spectral bandwidth and
6. The position of the optical reference plane of the measuring head, which does not necessarily coincide with its front surface.
Mathematically, these corrections can be expressed by multiplication of the spectrometer signal with appropriate correction factors.
2. MEASUREMENT UNCERTAINTY ANALYSIS
Determining the measurement uncertainty is an integral part of a calibration. We analyze it based on a Monte-Carlo approach as described in the GUM3 supplement 1. The basic idea of this approach is the recalculation of EDUT(λ) many times, while all input quantities are altered on each iteration according to their uncertainties, the uncertainty distribution functions and the underlying model of impact on the result. The resulting distribution of EDUT(λ) then directly yields an estimate of its uncertainty.
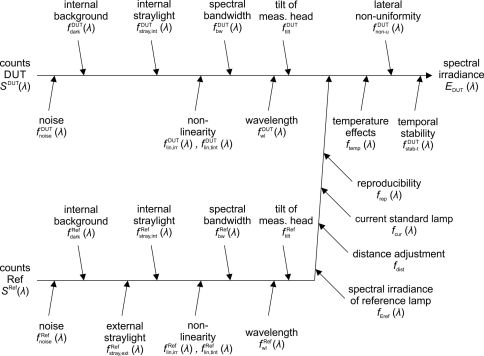
Figure 1 shows an Ishikawa diagram of all identified sources of uncertainty for the determination of the spectral irradiance of the solar simulator. Each of these components affects the result of the measurement in a specific way. On each iteration of the Monte-Carlo algorithm, corresponding f-factors are calculated and multiplied with EDUT(λ) in order to reflect the impact of uncertainty of the input quantities.
Figure 1: Ishikawa diagram of all identified sources of measurement uncertainty. Figure taken from [6]
For the correct determination of uncertainty, it is important to consider that some uncertainty contributions introduce correlations with respect to wavelength. This holds for the contributions due to detector linearity, tilt of the measuring head, distance adjustment, operation current of the lamp, temporal stability of the radiometric correction (reproducibility), temperature effects, lateral nonuniformity and temporal stability of the DUT light source. Moreover, wavelength calibration and spectral bandwidth of the spectrometer introduce wavelength dependent correlations between reference and DUT measurement. Accounting for such correlations is important for further processing in spectral integrals, e.g., for solar simulator spectral mismatch correction according to the IEC 60904-7 standard4. In order to correctly take correlations into account in the Monte-Carlo analysis, the f-factors have to be calculated in the correct order and correct places in the algorithm. The Monte-Carlo analysis therefore implements two nested loops, one for the N Monte-Carlo iterations (N ≥ 10000 is recommended) and an inner one for looping over wavelength. Depending on whether an uncertainty contribution affects the whole spectral distribution or not, the random number defining the specific value of the corresponding f-factor is obtained before or within the inner loop. In order to account for correlations between reference and DUT measurement, the same random numbers are used for the corresponding f-factors. In total, 20 random numbers for different f-factors are drawn in each Monte-Carlo iteration using a random number generator. Details about this implementation can be found in the sample Python code for this analysis provided on the Website of ISFH CalTeC.
3. EXAMPLE
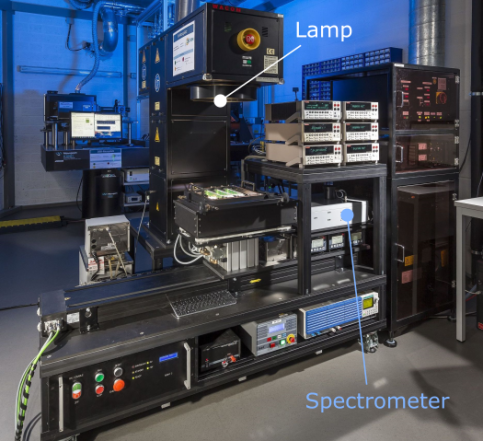
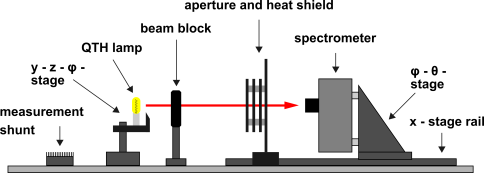
Figure 2 shows ISFH CalTeC's solar simulator, which is used for certified measurements of solar cells. The solar simulator forms part of a current-voltage characteristic (IV) measuring facility, which is a two lamp system (Xenon and Halogen) from WACOM (WXS-156 S-L2) and produces a spectral irradiance similar to the AM1.5G distribution as tabulated in the IEC 60904-3 standard. The size of the quadratic light-field is 170 x 170 mm2. The solar simulator is rated as AAA (rating for: spectral match to AM1.5G, non-uniformity of irradiance and instability of irradiance) according to the IEC60904-9 standard. For a convenient and fast determination of the spectral irradiance, an array spectrometer is integrated on a motorized stage. The spectral irradiance of the solar simulator is acquired for each solar cell calibration measurement and thus very often. In order to achieve short measurement times of the order of seconds, we use a custom-made array spectrometer. A schematic of the calibration facility for determining the radiometric correction function for our spectrometer is shown in Fig. 3: A reference lamp with known spectral irradiance in the measuring plane (obtained from a primary calibration at PTB) is used for the determination of the radiometric correction function. During operation, the electrical power of the reference lamp is continuously monitored in order to ensure a stable spectral irradiance distribution. Stray light from the surrounding is reduced by an aperture placed between the reference lamp and the measuring head of the spectrometer. Accurate distance adjustment is achieved by mounting the spectrometer on a stage rail.
Figure 2: ISFH CalTeC's solar simulator. Figure taken from [6]
Figure 3: Schematic of ISFH CalTeC's calibration facility for spectrometers. Figure taken from [6]
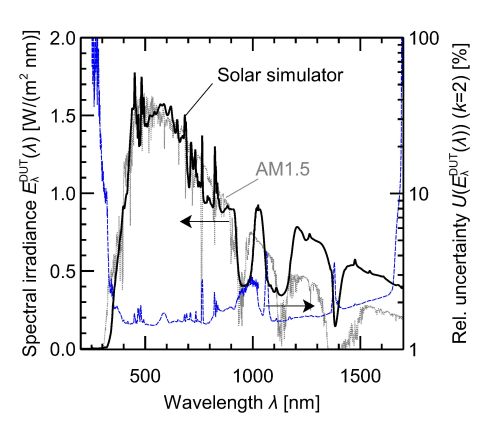
The measured spectral irradiance of the solar simulator (black line) and the measurement uncertainty resulting from our uncertainty analysis (blue line) are depicted in Fig. 4. The gray dotted curve shows the AM1.5 spectral distribution5 for comparison. The data for this figure can be reproduced by running the Python code example mentioned above. The relative measurement uncertainty is mostly of the order of 3%, except for the wavelength range below 400 nm, where the solar simulator does not emit radiation yet. The spectral irradiance of the solar simulator shown here is optimized for the analysis of silicon solar cells, which are not sensitive to light with wavelengths above 1200 nm.
Figure 4: Measured spectral irradiance of ISFH CalTeC's solar simulator and corresponding measurement uncertainty.
4. OUTLOOK
Spectral irradiance measurements are one link in the calibration chain for solar cells and enable the calculation of the spectral mismatch correction, which is required whenever the spectral irradiance of the solar simulator deviates from the tabulated reference spectral irradiance distribution - which is usually the case. In order to calculate the spectral mismatch correction factor (SMM), the spectral responsivity of the solar cell under test and the reference cell used for adjusting the solar simulator need to be known as well. The corresponding uncertainties also enter the final uncertainty of the SMM. Since the SMM is calculated via spectral integrals, it must be ensured that correlations of the data with respect to wavelength are properly taken into account by the whole analysis procedure. This can be achieved by setting up similar Monte-Carlo uncertainty analysis procedures for the spectral responsivity measurements and combining these with the uncertainty analysis procedure described in this article. The uncertainty analysis for spectral responsivity measurements will be covered by a future publication.
1R. Galleano et al.: Second international spectroradiometer intercomparison: results and impact on PV device calibration. Progress in Photovoltaics: Research and Applications, 23(7):929-938, 2015.
2R. Galleano et al.: Results of the fifth international spectroradiometer comparison for improved solar spectral irradiance measurements and related impact on reference solar cell calibration. IEEE Journal of Photovoltaics, 6(6):1587-1597, 2016.
3Guide to the Expression of Uncertainty in Measurements, BIPM (2008), https://www.bipm.org/utils/common/documents/jcgm/JCGM_100_2008_E.pdf
4International Electrotechnical Commission: IEC 60904-7:2019 https://www.vde-verlag.de/iec-normen/247936/iec-60904-7-2019.html.
5International Electrotechnical Commission: IEC 60904-3:2019 https://www.vde-verlag.de/iec-normen/247180/iec-60904-3-2019.html.
6C. Schinke et al., Calibrating spectrometers for measurements of the spectral irradiance caused by solar radiation. Metrologia, in press (2020). DOI: 10.1088/1681-7575/abafc5.


