Energy Rating with an LED-based solar simulators
Stefan Riechelmann, Hendrik Sträter; Physikalisch-Technische Bundesanstalt (PTB), Germany
To perform Energy Rating (ER) for PV modules according to the IEC 61853 standard (IEC 61853-3), several input parameters are needed:
- A power matrix based on IV-measurements under irradiances ranging from 100 W/m² to 1100 W/m² in four steps and temperatures from 15°C to 75°C in four steps
- The spectral responsivity (SR) of the module
- The effect of the angle of incidence (AOI) in which the irradiance is hitting the module
- The nominal module operating temperature (NMOT)
Typically, the first two input parameters can be derived with a state-of-the-art Xenon-based solar simulator combined with a temperature chamber and a couple of optical filters. In order to derive values for the power matrix at different irradiance levels, neutral-density filters are commonly used. The spectral responsivity is either determined on a cell-based level with a tunable light source or with the use of varying bandpass filters in the light path of the solar simulator. While SR measurements are conducted once, the measurements at different irradiance levels are performed at four different temperatures. This adds up to 22 individual measurements in total, if uncommon combinations of irradiance and temperature (e.g. 15°C and 1100 W/m²) are excluded. This means a lot of filter switching for laboratories, where this working step is not fully automated. In case of LED-based solar simulator systems, neither neutral-density nor bandpass filters are needed for the measurement of the power matrix and the SR.
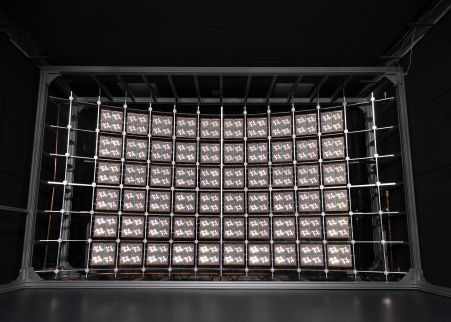
Figure 1: An LED-based solar simulator, consisting of 16.320 individual LEDs of 18 different colors. The arrangement covers an area of 350 cm x 230 cm.
Technical description of the simulator system
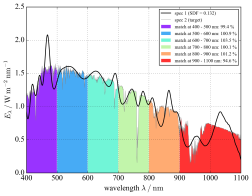
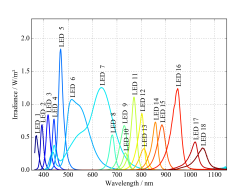
The commercial LED-based solar simulator (Figure 1) used in this study consists of 16.320 individual LEDs, covering an area of 350 cm x 230 cm. The emitted light field is of rectangular shape, focused by micro lenses to a 200 x 100 cm measurement plane. 18 different LED colors are covering the spectral range from 360 nm to 1100 nm (Figure 2). The emitted effective irradiance reaches to up to 1200 W/m² with a pulse duration from a few ms up to steady-state conditions over several hours. Compared to Xenon-based simulators, the spectrum can be altered without the use of filters by individually tuning each LED color channel and thus reaching a very close fit to the AM1.5 standard spectrum. With a non-uniformity of the light field of less than 2%, the simulator is classified as AAA according to IEC 609049. The variation of module temperature is realized with a temperature chamber, surrounding the PV module in the measurement plane and realizing module temperatures between 15°C and 75°C.
Figure 2: Left: Spectrum of the LED-based solar simulator, classified according to the IEC 60904-9. Right: Spectra of the individual 18 LED color-channels.The commercial LED-based solar simulator (Figure 1) used in this study consists of 16.320 individual LEDs, covering an area of 350 cm x 230 cm. The emitted light field is of rectangular shape, focused by micro lenses to a 200 x 100 cm measurement plane. 18 different LED colors are covering the spectral range from 360 nm to 1100 nm (Figure 2).
Measurement procedure
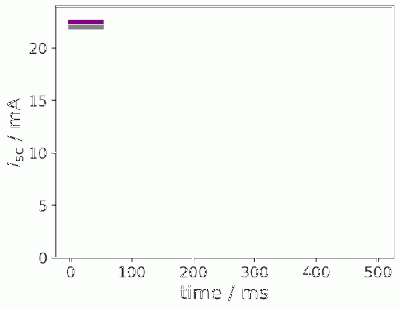
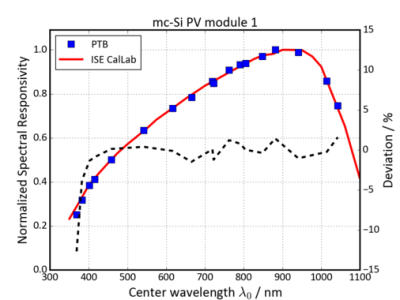
After mounting the PV module we first set our temperature chamber to 25°C and derive the SR by slightly increasing and decreasing each individual LED color with respect to an irradiance level predefined by the AM1.5 spectrum at 1000 W/m² (Figure 3). The signal used for the evaluation is therefore not a differential signal of the PV module, but a difference signal of the I&subsc;, recordable with a multimeter as voltage drop over a shunt resistor. The measurements are compared to a reference device, a linear WPVS solar cell (Osterwald et al. 1999), which has been calibrated at the PTB's own primary calibration facility for solar cells (Winter et al. 2000). The technique is described in detail in Sträter et al. 2019.
Figure 3: Top: SR derivation by slightly varying the individual LED power around an AM1.5 bias illumination. Bottom: validation by applying the method to a PV module that has also be calibrated at a filter-based facility at Fraunhofer ISE CalLab (Sträter et al. 2019).
After deriving the SR, the actual power matrix measurements are performed. The power matrix is measured with the help of a temperature chamber, which is used to set the module temperature to 15°C, 25°C, 50°C and 75°C, respectively. At each temperature, seven IV curve measurements at irradiances from 100 W/m² up to 1100 W/m² are performed. The intensity of the LED solar simulator can be varied nearly stepless, occurring spectral shifts due to varying LED temperatures are corrected by an LED-wise power adjustment. Since the limiting factor for Xenon-based systems is the number of neutral-density filters available, it is possible for LED-based systems to capture a power matrix with a much denser amount of measurement points, with a minimum amount of additional effort. In order to derive a power matrix with the exact temperature and irradiance specifications given in IEC 61853-1, corrections are made according to IEC 60891. At the end, the SR and the power matrix derived by the same instrument can then be used as input for the ER calculations.
Literature
Osterwald, C. R.; Anevsky, S.; Bücher, K.; Barua, A. K.; Chaudhuri, P.; Dubard, J. et al. (1999): The world photovoltaic scale: an international reference cell calibration program. In: Prog. Photovolt: Res. Appl. 7 (4), S. 287-297. DOI: 10.1002/(SICI)1099-159X(199907/08)7:4<287::AID-PIP259>3.0.CO;2-I.
IEC 61853-1, 2011: Photovoltaic (PV) module performance testing and energy rating- Part 1: Irradiance and temperature performance measurements and power rating.
IEC 61853-3, 2018: Photovoltaic (PV) module performance testing and energy rating- Part 3: Energy rating of PV modules.
Sträter, H.; Riechelmann, S.; Neuberger, F.; Winter, S. (2019): LED-Based Differential Spectral Responsivity Measurements of PV Modules. 36th European Photovoltaic Solar Energy Conference and Exhibition; 1121-1126 / 36th European Photovoltaic Solar Energy Conference and Exhibition; 1121-1126. DOI: 10.4229/EUPVSEC20192019-4AV.2.5.
Winter, S.; Wittchen, T.; Metzdorf, J.; Energies, WIP-Renewable (2000): Primary Reference Cell Calibration at the PTB Based on an Improved DSR Facility. In: Hermann Scheer (Hg.): Sixteenth European Photovoltaic Solar Energy Conference. Proceedings of the international conference held in Glasgow, United Kingdom, 1- 5 May 2000. London: James & James (European photovoltaic solar energy conference), S. 2198-2201.
